Integrated IoT Weather Station and Web-Based Climate Analytics Platform
📌 Project Overview
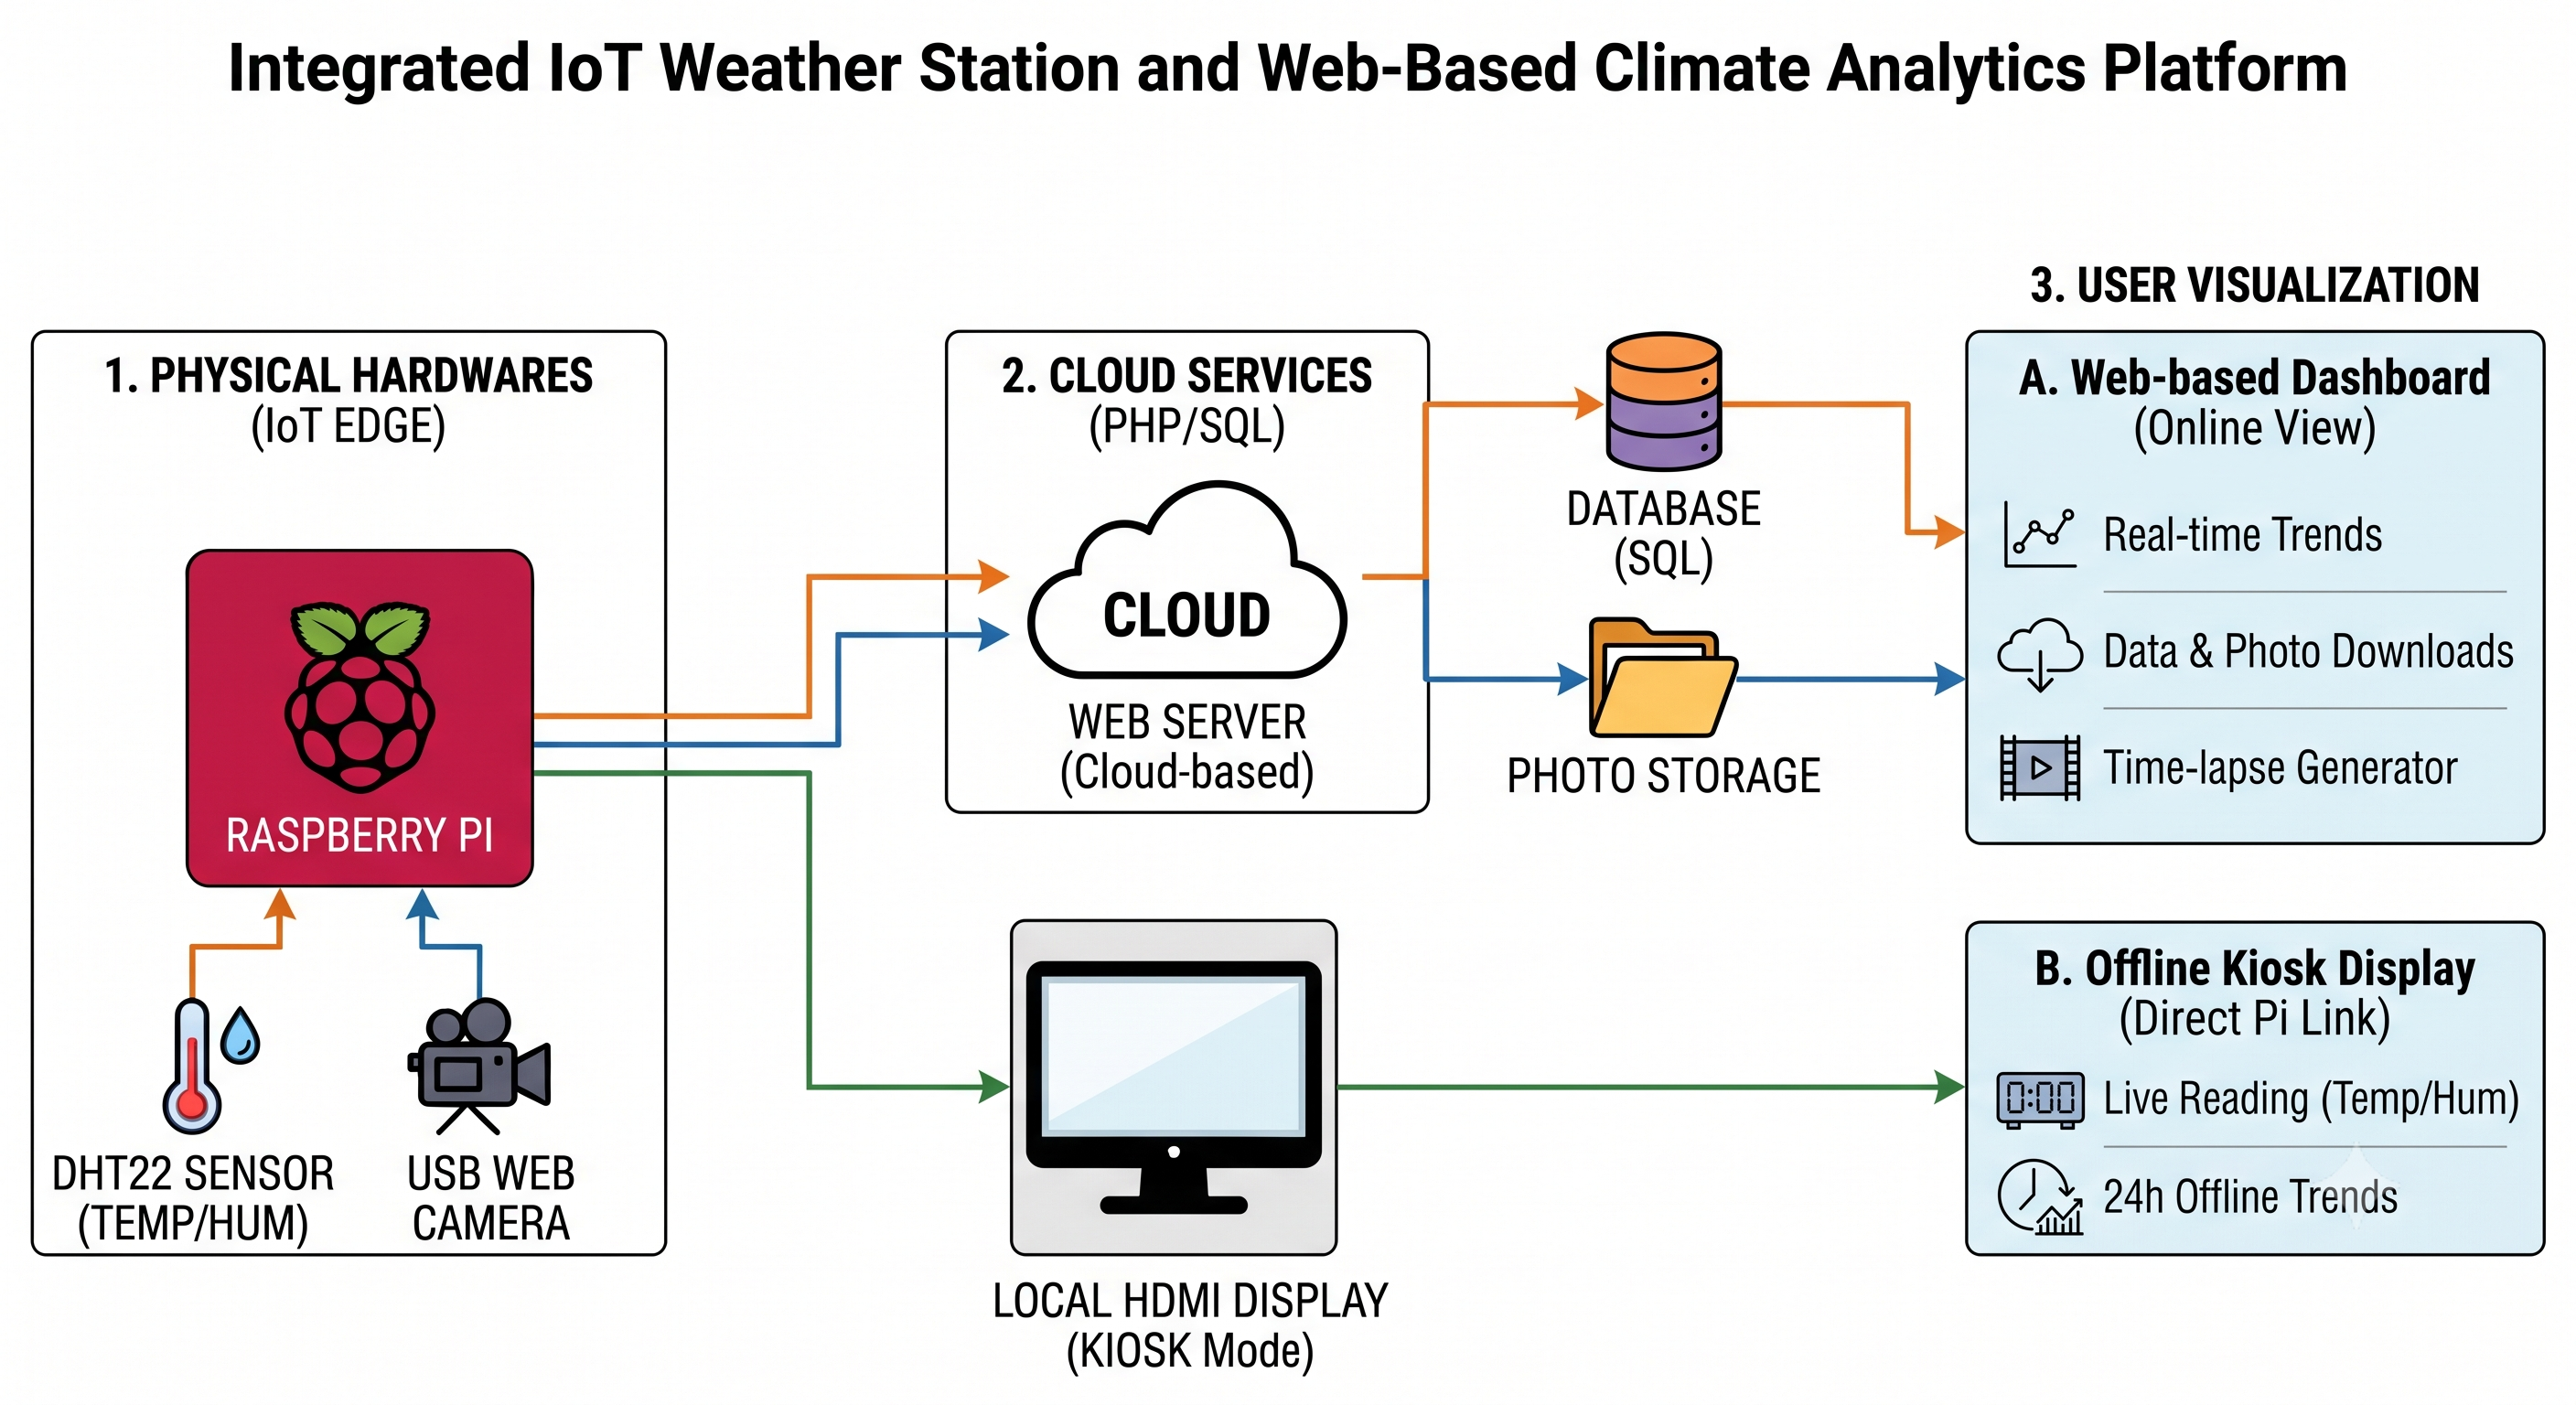
This project demonstrates a fully integrated system combining Internet of Things (IoT) with web-based data analytics. The platform covers the entire data pipeline: sensor data acquisition, real-time visual monitoring, micro-controller IoT bridging, an offline kiosk dashboard, server-side SQL database storage, and front-end dynamic data visualization alongside time-lapse video generation.
⚙️ Hardware & Data Pipeline
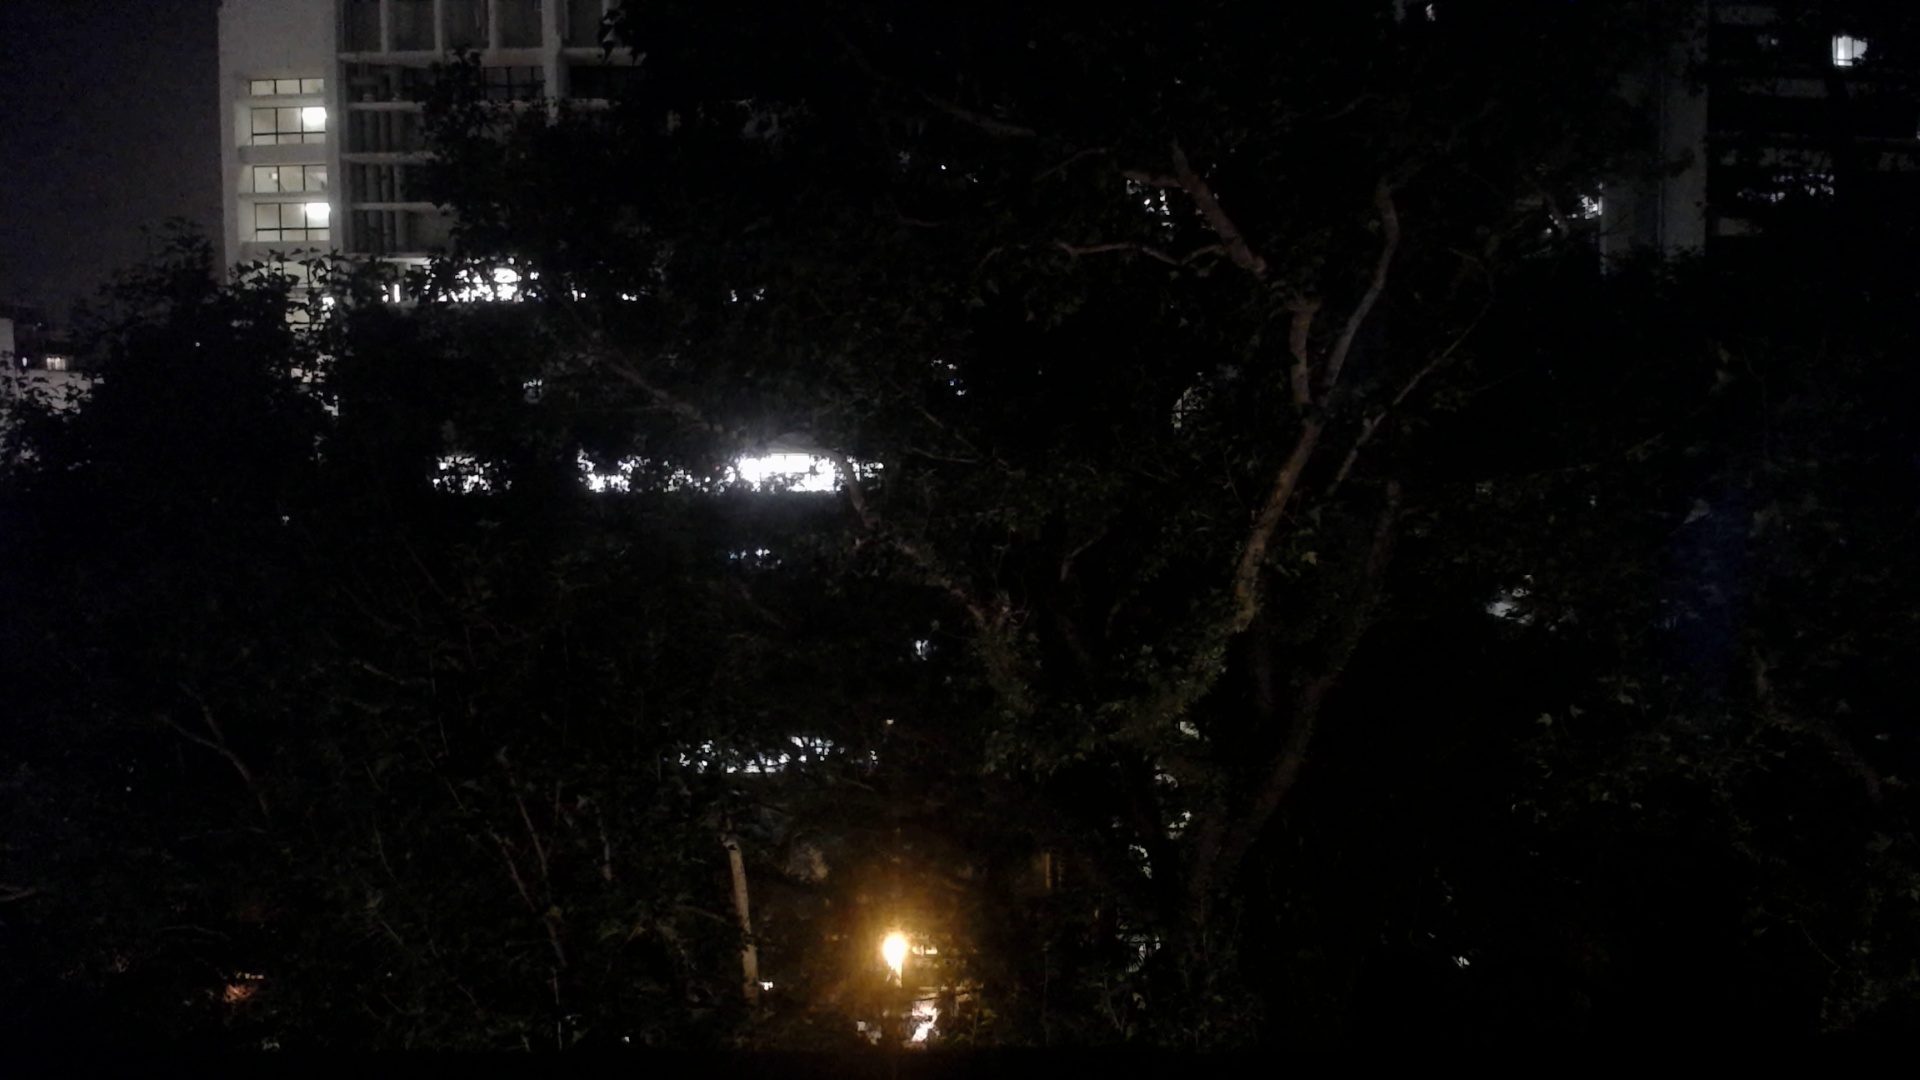
The edge hardware is powered by a Raspberry Pi 4B equipped with a DHT22 temperature and humidity sensor and an HD USB webcam. Python scripts run scheduled tasks to record real-time temperature and humidity data every 5 minutes alongside hourly high-resolution images. Using a dual-track backup strategy, the data is stored locally on the Raspberry Pi while simultaneously transmitted to the web server. Temperature and humidity data are logged into a MySQL database, while hourly observation images are organized chronologically in cloud photo directories.
🖥️ Offline Kiosk Dashboard
To ensure reliability in extreme conditions, the Raspberry Pi is connected to a compact HDMI display running a custom HTML dashboard. Even in standalone/offline environments, users on-site can directly view real-time temperature and humidity data, as well as historical trends.
🌐 Online Web Dashboard Features
The online web platform offers an enhanced suite of analytical tools:
- Live Weather Data & Observation Photo: Real-time temperature and humidity data update automatically, accompanied by 24-hour maximum and minimum records. Live observation photos update hourly.
- Dual Y-Axis Trend Analysis: Features an interactive Dual Y-Axis line chart (orange axis on the left for Temperature in °C, purple axis on the right for Relative Humidity in %).
- Smart Data Granularity: When selecting 1-day, 3-day, or 7-day views, the chart renders high-resolution trajectories. When extending to long-term periods (30-day, 90-day, or 1-year), the system automatically aggregates records into Daily Averages to highlight macro-climatic trends without visual clutter.
- Historical Data & Photo Download Center: Allows users to export historical temperature and humidity datasets as TXT files or download specific historical observation photos for further analysis.
🎥 Key Feature: Dynamic Time-lapse Generator
Located at the bottom of the webpage is the station’s showcase feature: an online Time-lapse Generator. Users can dynamically convert historical photo sequences into cinematic playback, featuring two distinct observation modes:
- Fixed-Hour Mode (Mode 1): Filter photos taken at a specific hour (e.g., 12:00 PM daily) across a selected date range to observe seasonal sunrise patterns, solar elevation shifts, or long-term environmental changes.
- Continuous Mode (Mode 2): Select up to a 14-day continuous sequence (24 photos per day) to experience smooth day-to-night transitions.
Beyond online playback, the generated time-lapse can be rendered on-the-fly and downloaded directly as an HD video with timestamp overlays.